With the impact of big data being felt now more than ever, countless businesses have begun to benefit as a result of their adjusted enterprise decision making. What’s surprising in spite of this, however, is that less and less organizations consider themselves as ‘data-driven.’ While the analysis provided as a result of big data does impact some businesses, others have trouble finding value from the analysis they conduct. It’s true that data collected can be quite valuable, but only when properly analyzed and when this analysis is used to derive a strategy.
Organizations weary about how big data could impact their processes must understand that impact can only be realized when they’re prioritizing data-first initiatives. In order to accomplish this, businesses must utilize the correct data-driven tools. One in particular that has provided immense value is Tableau.
Impacting What You See
The most important data collected by any business fuels the analysis they’ll conduct in hopes of gathering valuable information on their customers’ profiles. If done correctly, the right analysis can serve as a competitive advantage. What many businesses struggle with is finding ways to capitalize on the trends they identify.
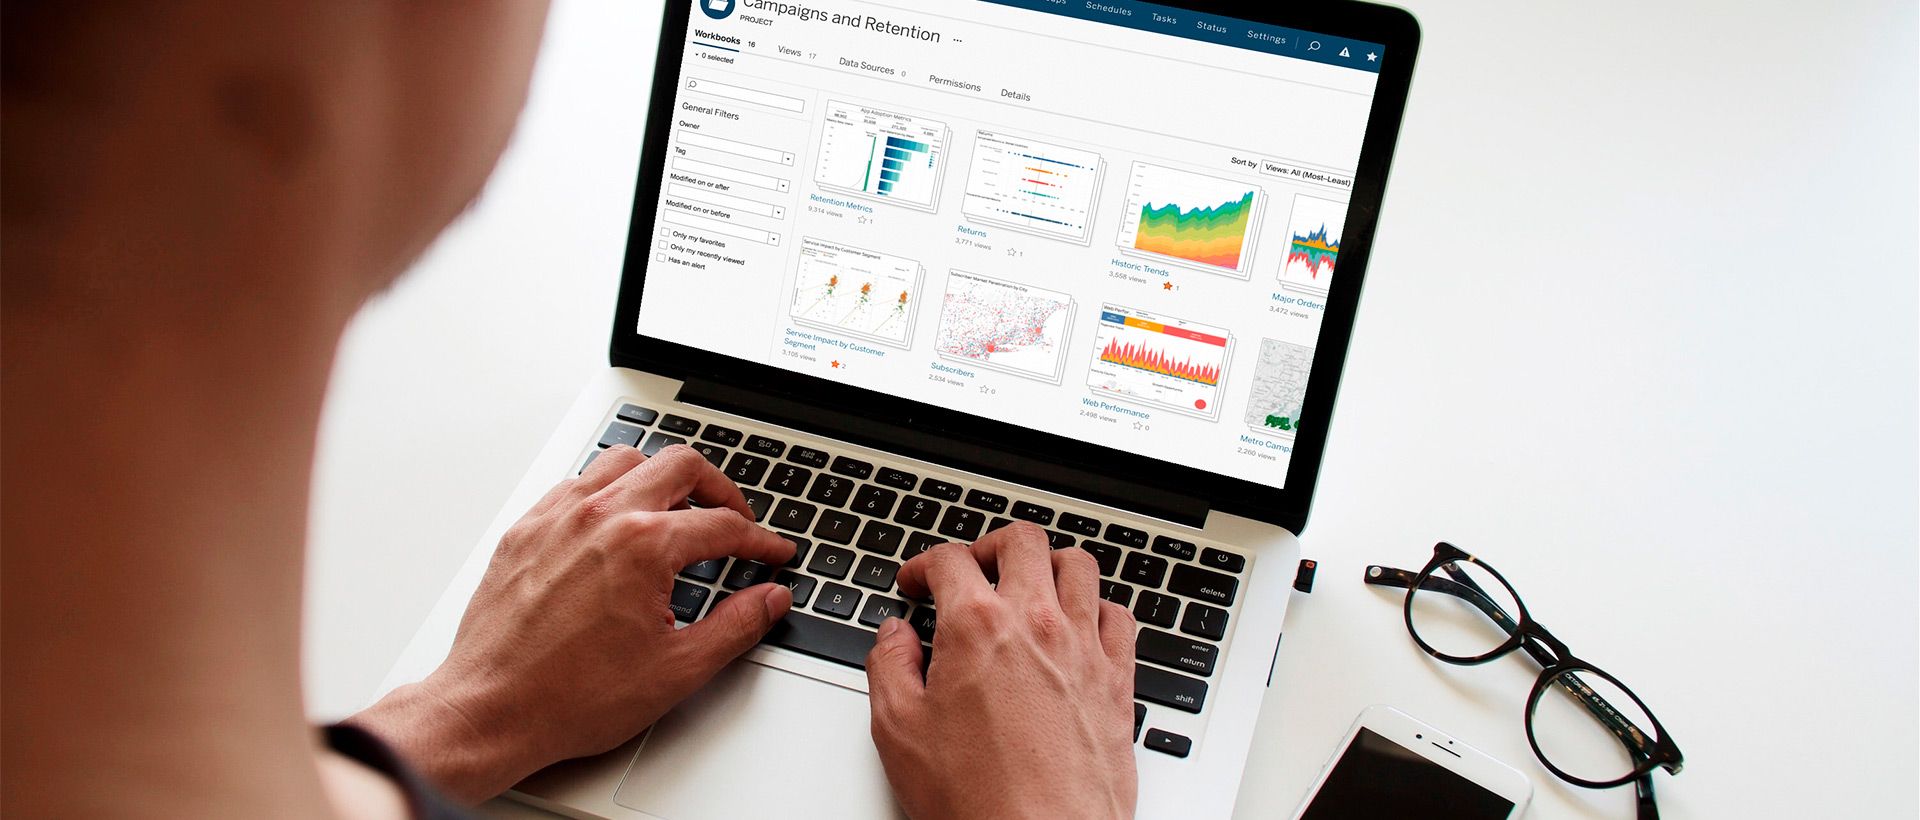
Therein lies the strength of Tableau for these businesses. Through a set of advanced visualization tools and capabilities, even the most unstructured data can become visual depictions that provide valuable insight. With such a friendly user interface, even the most novice analyst is capable of creating functional and interactive visual representations of the data they work with.
How Simplicity Helps
The best data-driven strategies often take some time to develop. Sometimes the most straightforward analysis can crumble under the smallest oversight. When these analyses fail, they’re often being impacted by a form of contrasting data. When this data invades an analysis, it often sticks out like a sore thumb, which causes confusion. This can be avoided through the help of Tableau’s data visualization tools.

Made possible through such a simplified user interface, very few analysts will have trouble with identifying ways that they can adjust the data to display accordingly. Even with contrasting data flooding through the analysis, Tableau’s functionality simplify the ways in which businesses can identify trends or patterns they see throughout these visualizations. With the right help, such as Tableau Training Courses, this is made much easier
Unlimited Data Capabilities
With such a wonderful user interface to use, what good is it without the right data? Tableau’s connectivity to their integrated network of the largest data sources that exist today makes all the difference. Google, SAP, Oracle, Azure, Splunk and more are all connected to this network, providing data on customers all throughout the world. This network gives organizations all the insight necessary into more overarching trends that can be seen throughout the world.
Measuring The Impact
With the opportunity to seize the value that data provides to enterprise decision-making; many businesses leave it all on the table. With Tableau, this wouldn’t have to be the case. Businesses can rely on proper collection, analysis, interpretation and application with the help of this software. With enough effort, attaining a competitive advantage becomes much easier for these businesses. Get the help your business needs today through streamlined data visualization tools, a user-friendly interface and the ability to dive deeper into the big picture.
Author Bio: Anne Fernandez – Anne joined Accelebrate in January 2010 to manage trainers, write content for the website, implement SEO, and manage Accelebrate’s digital marking initiatives. In addition, she helps to recruit trainers for Accelebrate’s Tableau Training Programs and works on various projects to promote the business.


