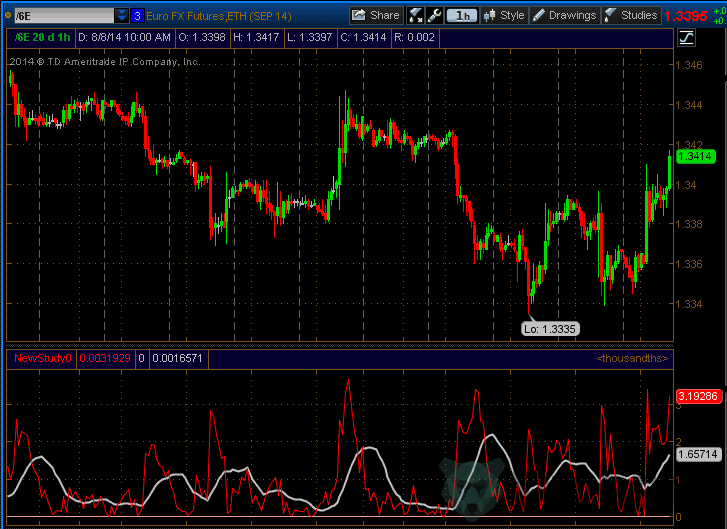
It was developed by Ken Wood, an experienced trader, and is widely recognized as one of the most important trading tools for traders of any level of experience. Woodies CCI Indicator was originally created for DFD traders, but it has been adopted by traders across a wide range of commodities and assets, such as cryptocurrency and Forex, due to its success as a CFD tool.
This system differs from other indicators in that it is a complete system, rather than a standalone indicator. The Woodies CCI Indicator can therefore be used on its own without relying on other technical analysis tools. CCI is a principle-based trading system that determines price movement by looking at the direction of the indicator. Check out our Best Metatrader Indicators page to see if this one makes the cut.
Woodies CCI Indicator: How Does It Work?
The Woodies CCI Indicator is an independent trading system composed of five components. These are:
1. Index of commodity channels:
The Commodity Channel Index is represented by the red lines. Red lines have a longer period than CCI Turbo. An oscillator-like indicator, it measures the difference between the average price and the price change.
CCI’s position determines asset prices. Whenever the indicator is rising, asset prices are above average, but when the indicator is in the opposite position, asset prices are below average. This makes the CCI the most important component of the Woodies CCI.

2. CCI Turbo:
Turbo lines are the green lines of the trading indicator. It is used in conjunction with the red lines to detect exit points and patterns rather than to analyze trends.
3. CCI Histogram:
Woodies CCI Indicator provides traders with an insight into the trading trend through its histogram. Positive trends are represented by histograms above the zero line and negative trends by histograms below the zero line. During an uptrend, the CCI must be above the zero line for a minimum of six bars, and during a downtrend, the CCI must be in the opposite direction for a minimum of six bars.
The color of the histogram bars is determined by CCI’s past performance. When the indicator is above the zero line for the 6 bars, the next bar will turn green. The bar will turn green if the indicator is below the zero line for at least 6 bars. For even greater trading results, read our latest article about price action indicators for MT4.
4. Zero Line:
The zero line serves as a major indicator of support or resistance in the system. This may indicate a trend if the CCI crosses the zero line without going back for at least six bars. Crossing above the zero line indicates an upward trend. If it crosses below the zero line, it indicates a downward trend.
Though sometimes, the zero line may work in conjunction with the Least Squares Moving Average (LSMA) indicator to show traders the condition of the price relative to the LSMA, specifically whether it is above or below it. LSMA calculates moving averages specifically for Woodies CCI Indicator. Therefore, the indicator’s red areas show that current prices are below the LSMA, while green areas indicate that prices are above the LSMA.

